Charts
We will generate charts dynamically and serve them through the Resources API.
For resource-backed
srcvalues and cached assets, see Resources.
./dashboard.gox
Charts
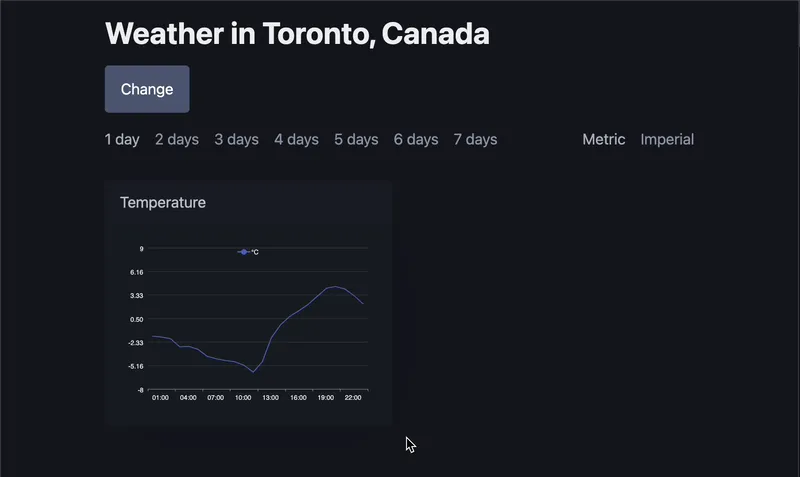
Temperature
Start with the temperature chart. First, prepare the content layout:
elem (d dashboard) Main() {
	~/* ... */
	<section>
		~(d.change())
		~(d.menu())
	</section>
	~(if city.IsValid() {
		<section>
			~(d.charts(city))
		</section>
	})
}

// component with all charts
elem (d dashboard) charts(city driver.City) {
	<div class="grid">
		<div></div>
		<div></div>
	</div>
}
Next, generate and serve the temperature chart while learning a new pattern: a React-style functional component.
A proxy, such as ~>(new(doors.Door)), captures whatever follows. We can even proxy a GoX ~func literal.
A GoX func literal (
~func) is evaluated immediately, and its return value is rendered in place.
elem (d dashboard) charts(city driver.City) {
	<div class="grid">
		<div>
			~// Make a dynamic container with the content returned by ~func.
			~>(new(doors.Door)) ~func {
				days, _ := d.days.Effect(ctx)
				units, ok := d.units.Effect(ctx)
				if !ok {
					return nil
				}

				values, _ := driver.Weather.Temperature(ctx, city, units, days)
				// Generate []byte.
				svg, _ := driver.ChartLine(values.Values, values.Labels, units.Temperature())

				return <article>
					~// Pass []byte directly into src.
					<img height="auto" width="100%" src=(svg) type="image/svg+xml"/>
				</article>
			}
		</div>
		<div></div>
	</div>
}
Doors detects that the value of src is []byte and creates a private temporary endpoint for it. The type attribute is used for the Content-Type header in the response.
Rest
Now prepare a separate chart component:
type chart struct {
	title string
	svg func() []byte
}

elem (c chart) Main() {
	<article>
		<header>
			~(c.title)
		</header>
		<img height="auto" width="100%" src=(c.svg()) type="image/svg+xml"/>
	</article>
}
And finally render all charts (some depend only on days, some on both days and units):
elem (d dashboard) charts(city driver.City) {
	<div class="grid">
		<div>
			~>(new(doors.Door)) ~func {
				days, _ := d.days.Effect(ctx)
				units, ok := d.units.Effect(ctx)
				if !ok {
					return nil
				}
				return chart{
					title: "Temperature",
					svg: func() []byte {
						values, _ := driver.Weather.Temperature(ctx, city, units, days)
						svg, _ := driver.ChartLine(values.Values, values.Labels, units.Temperature())
						return svg
					},
				}
			}
			~>(new(doors.Door)) ~func {
				days, ok := d.days.Effect(ctx)
				if !ok {
					return nil
				}
				return chart{
					title: "Humidity",
					svg: func() []byte {
						values, _ := driver.Weather.Humidity(ctx, city, days)
						svg, _ := driver.ChartLine(values.Values, values.Labels, "%")
						return svg
					},
				}
			}
		</div>
		<div>
			~>(new(doors.Door)) ~func {
				days, ok := d.days.Effect(ctx)
				if !ok {
					return nil
				}
				return chart{
					title: "Weather",
					svg: func() []byte {
						values, _ := driver.Weather.Code(ctx, city, days)
						svg, _ := driver.ChartPie(values.Values)
						return svg
					},
				}
			}
			~>(new(doors.Door)) ~func {
				days, _ := d.days.Effect(ctx)
				units, ok := d.units.Effect(ctx)
				if !ok {
					return nil
				}
				return chart{
					title: "Wind Speed",
					svg: func() []byte {
						values, _ := driver.Weather.WindSpeed(ctx, city, units, days)
						svg, _ := driver.ChartLine(values.Values, values.Labels, units.WindSpeed())
						return svg
					},
				}
			}
		</div>
	</div>
}
The result:
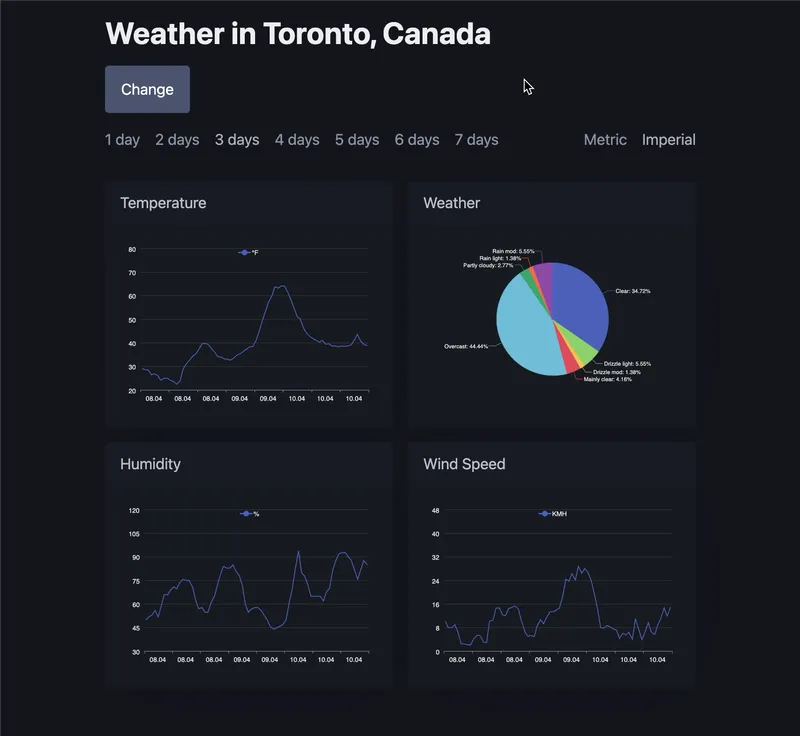
Next: UX
Code
./dashboard.gox
package main

import (
	"github.com/doors-dev/doors"
	"github.com/doors-dev/gox"
	"github.com/doors-dev/tutorial/driver"
)

func WeatherDashboard(path doors.Source[Path]) gox.Comp {
	city := doors.DeriveBeam(path, func(p Path) int {
		return p.CityID
	})
	days := doors.DeriveBeam(path, func(p Path) int {
		return p.days()
	})
	units := doors.DeriveBeam(path, func(p Path) driver.Units {
		return p.units()
	})
	return city.Bind(elem(cityID int) {
		~dashboard{
			cityID: cityID,
			days: days,
			units: units,
		}
	})
}

type dashboard struct {
	cityID int
	days doors.Beam[int]
	units doors.Beam[driver.Units]
}

elem (d dashboard) Main() {
	~{
		city, _ := driver.Locations.CitiesGet(d.cityID)
	}
	~(if !city.IsValid() {
		~(doors.Status(404))
		<title>Not Found</title>
		<h1>City Not Found</h1>
	} else {
		<title>~(city.Name) Weather</title>
		<h1>Weather in ~(city.Name, ", ", city.Country.Name)</h1>
	})
	<section>
		~(d.change())
		~(d.menu())
	</section>
	~(if city.IsValid() {
		<section>
			~(d.charts(city))
		</section>
	})
}

elem (d dashboard) change() {
	~>(new(doors.Door)) <>
		~{
			days, _ := d.days.Effect(ctx)
			units, ok := d.units.Effect(ctx)
		}
		~(if ok {
			<a
				class="secondary"
				(doors.ALink{
					Model: Path{
						Route: Selector,
						Days: daysQuery(days),
						Units: unitsQuery(units),
					},
				})
				role="button">
				Change
			</a>
		})
	</>
}

elem (d dashboard) menu() {
	<nav>
		~(d.units.Bind(d.daysNav))
		~(d.days.Bind(d.unitNav))
	</nav>
}

elem (d dashboard) daysNav(units driver.Units) {
	<ul>
		~(for i := range 7 {
			~{
				days := i + 1
			}
			<li>
				~navLink{
					city: d.cityID,
					days: days,
					units: units,
					text: <>
						~(days)
						~(if days == 1 {
							 day
						} else {
							 days
						})
					</>,
				}
			</li>
		})
	</ul>
}

elem (d dashboard) unitNav(days int) {
	<ul>
		~(for _, units := range []driver.Units{driver.Metric, driver.Imperial} {
			<li>
				~navLink{
					city: d.cityID,
					days: days,
					units: units,
					text: units,
				}
			</li>
		})
	</ul>
}

type navLink struct {
	city int
	days int
	units driver.Units
	text any
}

elem (l navLink) Main() {
	<a
		class="secondary"
		(doors.ALink{
			Model: Path{
				Route: Dashboard,
				CityID: l.city,
				Days: daysQuery(l.days),
				Units: unitsQuery(l.units),
			},
		})>
		~(l.text)
	</a>
}

elem (d dashboard) charts(city driver.City) {
	<div class="grid">
		<div>
			~>(new(doors.Door)) ~func {
				days, _ := d.days.Effect(ctx)
				units, ok := d.units.Effect(ctx)
				if !ok {
					return nil
				}
				return chart{
					title: "Temperature",
					svg: func() []byte {
						values, _ := driver.Weather.Temperature(ctx, city, units, days)
						svg, _ := driver.ChartLine(values.Values, values.Labels, units.Temperature())
						return svg
					},
				}
			}
			~>(new(doors.Door)) ~func {
				days, ok := d.days.Effect(ctx)
				if !ok {
					return nil
				}
				return chart{
					title: "Humidity",
					svg: func() []byte {
						values, _ := driver.Weather.Humidity(ctx, city, days)
						svg, _ := driver.ChartLine(values.Values, values.Labels, "%")
						return svg
					},
				}
			}
		</div>
		<div>
			~>(new(doors.Door)) ~func {
				days, ok := d.days.Effect(ctx)
				if !ok {
					return nil
				}
				return chart{
					title: "Weather",
					svg: func() []byte {
						values, _ := driver.Weather.Code(ctx, city, days)
						svg, _ := driver.ChartPie(values.Values)
						return svg
					},
				}
			}
			~>(new(doors.Door)) ~func {
				days, _ := d.days.Effect(ctx)
				units, ok := d.units.Effect(ctx)
				if !ok {
					return nil
				}
				return chart{
					title: "Wind Speed",
					svg: func() []byte {
						values, _ := driver.Weather.WindSpeed(ctx, city, units, days)
						svg, _ := driver.ChartLine(values.Values, values.Labels, units.WindSpeed())
						return svg
					},
				}
			}
		</div>
	</div>
}

type chart struct {
	title string
	svg func() []byte
}

elem (c chart) Main() {
	<article>
		<header>
			~(c.title)
		</header>
		<img height="auto" width="100%" src=(c.svg()) type="image/svg+xml"/>
	</article>
}